Rich text in Tableau: how to use it
5-SECOND SUMMARY:
- What is rich text and how to make your Tableau dashboards stand out using Write-Back;
- There are many use cases from organizations all over the world where rich text can be used effectively.
The rich text enables individual text formatting and ensures you can be more expressive when displaying text on Tableau. If you’re a Tableau user, you’ve certainly longed for this feature at some point, both from implementer and end-user points of view. This theory is robustly confirmed by the number of questions, suggestions, ideas and requests on Tableau community forums asking Tableau to support the use of rich text
Qualitative analysis plays an important part in any analytics process. It’s possible to get more context by providing additional information; effectively going beyond what the numbers immediately state. Having specialists commenting on existing analysis and putting it into context for other users means that everyone will get more value from the analysis and become better at communicating.
Rich text supports text formatting, such as bold, italics and underlining as well as different fonts, font sizes and coloured text. Furthermore, it allows for structuring the text using block quotes, bullets and numbered lists, paragraphs and tabs.
Most word processors, such as Microsoft Word, Lotus Word Pro and AppleWorks, already have this functionality, which makes it easier for users to use and understand.

There are many use cases from organizations all over the world where rich text can be used effectively.
- Monthly considerations and performance analyses
- We have seen several cases where rich text is used in monthly or quarterly analyses of the employee or team performance.
These analyses require more characters, and the way in which information is structured and the most relevant parts are highlighted makes all the difference to how the message is transmitted and understood.
- Tableau presentations.
- In some organisations, there is a need for ‘offline’ presentations.
Typically, the process is time-consuming and laborious, as it requires the adaptation of Tableau data, finished off with a rich qualitative analysis.
Export-ready visualisations can be created with rich text, ensuring that data is up to date, yet still saving time and effort preparing it.
- Visualisation guidance
- Complementarity with native Tableau functionality such as Data Stories makes it possible to enrich visualisation and user experience further during analysis with additional information.
- We’ve seen some organisations complement their documentation, notes and user guides with more detailed, intuitive analyses, directly in Tableau dashboards.
The answer is simple: Write-Back for Tableau. Write-Back is a Tableau extension that enables users to submit data directly from a Tableau dashboard to your database, allowing to implement any actionable use case without leaving the analysis flow. Additionally, considering the needs mentioned above and feedback from our customers, we decided to take the next step and make rich-text functionality available.
Besides this, we continue to maintain the high standards of an enterprise-grade extension, providing security, auditing and other corporate features that will blend in with your infrastructure.

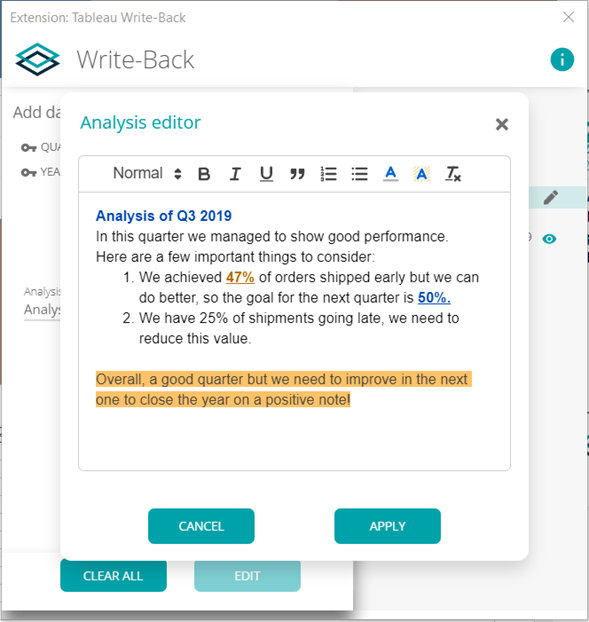
As we can see in the image above, the submission menu presents the standard options when it comes to Rich text. In addition to allowing information submission of up to 4000 characters, font styles, bold, Italics, underlining, quotes, numbering, bullets, font and text highlight color.

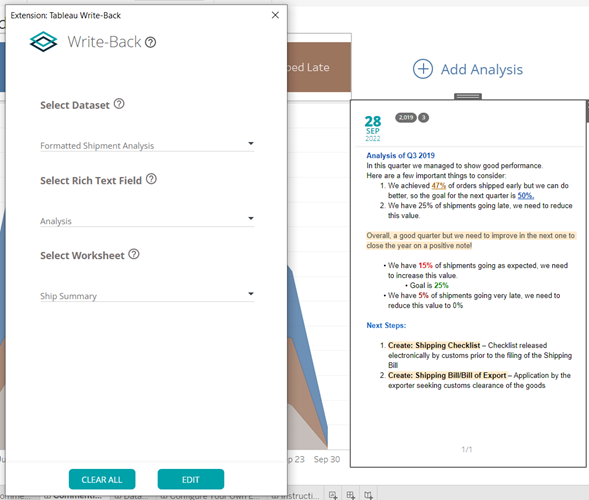
As this is a specific Write-Back feature, a component (Rich Text Viewer) is needed to display the formatted information in the visualization.
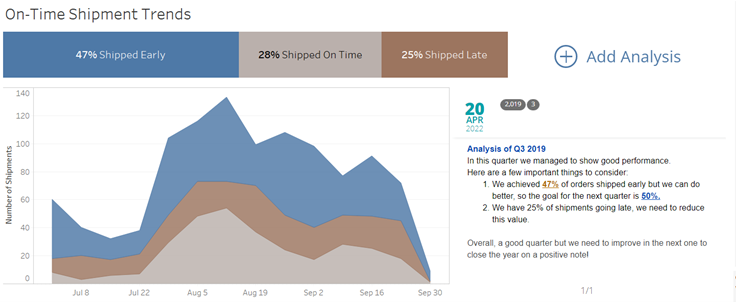
As shown in the image, this component is completely integrated into the dashboard/visualization, not compromising its creation and even helping to increase the user experience.
Long story short, we really believe, we’ve turned good into better by bringing this much-desired functionality to Tableau. Use cases to provide qualitative analysis is now more flexible for everyone. This way, we are helping to make Tableau more and more intuitive and accepted in organizations, not only as a visualization tool but as a collaborative one.

